
May 2017 Review
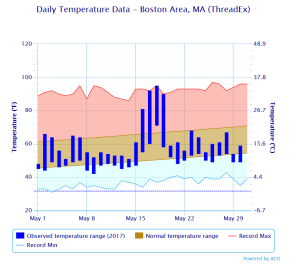
If you take a look at the graph above, you will see blue rectangles varying in size for each day of May, besides today. Those rectangles represent how the temperature ranged in a 24 hour period in Boston, with the bottom representing the lowest recorded temperature, and the top of the rectangle indicating the maximum temperature.
If one were to take a quick glance and give a monthly assessment on temperature, I would say it was a chilly month, featuring many cloudy days and/or days that were dominated by onshore flow/sea breeze. Days that were sunny and had a modest offshore flow nearly broke high temperature records.
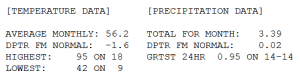
If you put all those numbers together, the month will end up 1.6 degrees cooler than the 30 year average, despite a high temperature of 95 degrees on the 18th. Rainfall should remain close to average despite what may try to survive later on, more on that below.
Next 12 Hours
Going back to the temperature graph real quick, it’s easy to notice the rather consistent temperature pattern as of late, which lacks significant diurnal range, and falls short of average. This temperature pattern suggests a marine layer has been in place for quite some time, which is consistent with observed wind directions ranging from east to northeast. Now taking a look at the SPC day 1 outlook for severe weather, there is a sharp gradient in threat located right along the western extent on the marine layer, just to the west of Boston. Convection has already initiated in western NY where sufficient diurnal heating and mid-level drying are occurring. Given the lack of a front, these storms will remain in clusters as they move east. Once the storms encounter the marine layer, they will weaken quickly, providing little to no impact to the Boston area.
Looking Beyond


Referring back to my discussion on the temperature pattern, the warmest days occurred with ample sunshine and offshore wind flow. We will be very close to the pattern Thursday through Sunday, although recent rainfall and cool air aloft will allow for daily cloud build up. The two graphics above and below describe trends in moisture and wind profiles over time. On the left is a range of model solutions for moisture quantity and on the right is a single solution for wind direction and speed. Time, which is on the horizontal axis is in Zulu time, where 12z is 7AM and 00z is 7PM.


Moisture returns gradually into next week, with unknown extent denoted by large ensemble spread. The wind flow returns to an onshore direction Monday and Tuesday, bringing a renewed period of persistent cloudiness and cool temperatures, along with the threat for rainfall. Needless to say, enjoy Thursday through Sunday.
